Foreword
Analyzing Your Site traffic
If you want statistics and data from your site, consider signing up to an
analytics service. One of the most popular methods for tracking site statistics
is Google Analytics (GA), which collects information about site visitors’
hardware, software and behavior. GA lets you track visitors as they progress
through your site, in order to build up a picture of how they use it.
For example, if you have a site consisting of a home page, a product catalogue
and an order form, GA will tell you what percentage of the visitors who browse
your catalogue subsequently abandon their shopping cart rather than paying for
its contents.
Google Analytics is free! While there are two available versions, free and
premium, most of the time the free version is all you need. Just sign up for an
account, and they will give you a couple of lines of HTML code that you need to
include in the header section of every page on your site. Once this is done,
Google silently tracks all your visitors, then you just log into the control
panel to view the data.
Finding browser statistics about your site’s visitors is pretty
straightforward. You can find information such as the types of browser your
visitors use, and how often they use each browser both in number and percentage.
You can even find out these details for specific browser versions.
Analyzing this information will allow you to determine how to emphasis
the design of your site. For example, if the majority of your site's visitors
browse your site using mobile devices, then more emphasis should be placed on
designing your site for the smaller viewports.
The following statistical information in this section was generated by
Google Analytics.
Statistics
Web Statistics

The following information consists of a comprehensive example of
month-by-month logged traffic, covering several years from the
W3Schools.com website.
Web browsers
 |
Google Chrome was released in 2008,
and is one of the most popular browsers today. |
 |
Mozilla Firefox was released in
2004, and is one of the most popular browsers today. |
 |
Internet Explorer from Microsoft was
released in 1995, and is resurging in popularity. |
 |
Apple Safari is the default browser
for Mac systems. Safari is known for its sleek design. |
 |
Opera is a fast standards-compliant
browser, often used in small devices, tablets, and phones. |
Browser Statistics
What is the trend in browser usage? To determine how to handle
different browser issues, you need to understand your visitors. To do that, you
need to look at your site statistics.
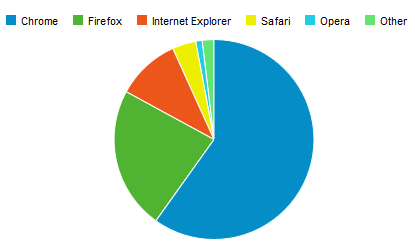
Browser Statistics and Trends
Statistics are important information.
From the statistics below (collected from W3Schools' log-files since 2002),
you can read the long term trends of browser usage.
The result clearly show that Google Chrome is the single
most used browsers by the visitors to this site.
Browser Statistics
 |
Click on a browser name to view detailed information: |
| 2015 |
Chrome |
IE |
Firefox |
Safari |
Opera |
| December |
68.0 % |
6.3 % |
19.1 % |
3.7 % |
1.5 % |
| November |
67.4 % |
6.8 % |
19.2 % |
3.9 % |
1.5 % |
| October |
66.5 % |
6.9 % |
20.0 % |
3.8 % |
1.4 % |
| September |
65.9 % |
7.2 % |
20.6 % |
3.6 % |
1.4 % |
| August |
64.0 % |
6.6 % |
21.2 % |
4.5 % |
2.2 % |
| July |
63.3 % |
6.5 % |
21.6 % |
4.9 % |
2.5 % |
| June |
64.8 % |
7.1 % |
21.3 % |
3.8 % |
1.8 % |
| May |
64.9 % |
7.1 % |
21.5 % |
3.8 % |
1.6 % |
| April |
63.9 % |
8.0 % |
21.6 % |
3.8 % |
1.5 % |
| March |
63.7 % |
7.7 % |
22.1 % |
3.9 % |
1.5 % |
| February |
62.5 % |
8.0 % |
22.9 % |
3.9 % |
1.5 % |
| January |
61.9 % |
7.8 % |
23.4 % |
3.8 % |
1.6 % |
| 2014 |
Chrome |
IE |
Firefox |
Safari |
Opera |
| December |
61.6 % |
8.0 % |
23.6 % |
3.7 % |
1.6 % |
| November |
60.1 % |
9.8 % |
23.4 % |
3.7 % |
1.6 % |
| October |
60.4 % |
9.5 % |
23.4 % |
3.9 % |
1.6 % |
| September |
59.6 % |
9.9 % |
24.0 % |
3.6 % |
1.6 % |
| August |
60.1 % |
8.3 % |
24.7 % |
3.7 % |
1.8 % |
| July |
59.8 % |
8.5 % |
24.9 % |
3.5 % |
1.7 % |
| June |
59.3 % |
8.8 % |
25.1 % |
3.7 % |
1.8 % |
| May |
59.2 % |
8.9 % |
24.9 % |
3.8 % |
1.8 % |
| April |
58.4 % |
9.4 % |
25.0 % |
4.0 % |
1.8 % |
| March |
57.5 % |
9.7 % |
25.6 % |
3.9 % |
1.8 % |
| February |
56.4 % |
9.8 % |
26.4 % |
4.0 % |
1.9 % |
| January |
55.7 % |
10.2 % |
26.9 % |
3.9 % |
1.8 % |
| 2013 |
Chrome |
IE |
Firefox |
Safari |
Opera |
| December |
55.8 % |
9.0 % |
26.8 % |
3.8 % |
1.9 % |
| November |
54.8 % |
10.5 % |
26.8 % |
4.0 % |
1.8 % |
| October |
54.1 % |
11.7 % |
27.2 % |
3.8 % |
1.7 % |
| September |
53.2 % |
12.1 % |
27.8 % |
3.9 % |
1.7 % |
| August |
52.9 % |
11.8 % |
28.2 % |
3.9 % |
1.8 % |
| July |
52.8 % |
11.8 % |
28.9 % |
3.6 % |
1.6 % |
| June |
52.1 % |
12.0 % |
28.9 % |
3.9 % |
1.7 % |
| May |
52.9 % |
12.6 % |
27.7 % |
4.0 % |
1.6 % |
| April |
52.7 % |
12.7 % |
27.9 % |
4.0 % |
1.7 % |
| March |
51.7 % |
13.0 % |
28.5 % |
4.1 % |
1.8 % |
| February |
50.0 % |
13.5 % |
29.6 % |
4.1 % |
1.8 % |
| January |
48.4 % |
14.3 % |
30.2 % |
4.2 % |
1.9 % |
| 2012 |
Chrome |
IE |
Firefox |
Safari |
Opera |
| December |
46.9 % |
14.7 % |
31.1 % |
4.2 % |
2.1 % |
| November |
46.3 % |
15.1 % |
31.2 % |
4.4 % |
2.0 % |
| October |
44.9 % |
16.1 % |
31.8 % |
4.3 % |
2.0 % |
| September |
44.1 % |
16.4 % |
32.2 % |
4.2 % |
2.1 % |
| August |
43.7 % |
16.2 % |
32.8 % |
4.0 % |
2.2 % |
| July |
42.9 % |
16.3 % |
33.7 % |
3.9 % |
2.1 % |
| June |
41.7 % |
16.7 % |
34.4 % |
4.1 % |
2.2 % |
| May |
39.3 % |
18.1 % |
35.2 % |
4.3 % |
2.2 % |
| April |
38.3 % |
18.3 % |
35.8 % |
4.5 % |
2.3 % |
| March |
37.3 % |
18.9 % |
36.3 % |
4.4 % |
2.3 % |
| February |
36.3 % |
19.5 % |
37.1 % |
4.5 % |
2.3 % |
| January |
35.3 % |
20.1 % |
37.2 % |
4.3 % |
2.4 % |
| 2011 |
Chrome |
IE |
Firefox |
Safari |
Opera |
| December |
34.6 % |
20.2 % |
37.7 % |
4.2 % |
2.5 % |
| November |
33.4 % |
21.2 % |
38.1 % |
4.2 % |
2.4 % |
| October |
32.3 % |
21.7 % |
38.7 % |
4.2 % |
2.4 % |
| September |
30.5 % |
22.9 % |
39.7 % |
4.0 % |
2.2 % |
| August |
30.3 % |
22.4 % |
40.6 % |
3.8 % |
2.3 % |
| July |
29.4 % |
22.0 % |
42.0 % |
3.6 % |
2.4 % |
| June |
27.9 % |
23.2 % |
42.2 % |
3.7 % |
2.4 % |
| May |
25.9 % |
24.9 % |
42.4 % |
4.0 % |
2.4 % |
| April |
25.6 % |
24.3 % |
42.9 % |
4.1 % |
2.6 % |
| March |
25.0 % |
25.8 % |
42.2 % |
4.0 % |
2.5 % |
| February |
24.1 % |
26.5 % |
42.4 % |
4.1 % |
2.5 % |
| January |
23.8 % |
26.6 % |
42.8 % |
4.0 % |
2.5 % |
| 2010 |
Chrome |
IE |
Firefox |
Safari |
Opera |
| December |
22.4 % |
27.5 % |
43.5 % |
3.8 % |
2.2 % |
| November |
20.5 % |
28.6 % |
44.0 % |
4.0 % |
2.3 % |
| October |
19.2 % |
29.7 % |
44.1 % |
3.9 % |
2.2 % |
| September |
17.3 % |
31.1 % |
45.1 % |
3.7 % |
2.2 % |
| August |
17.0 % |
30.7 % |
45.8 % |
3.5 % |
2.3 % |
| July |
16.7 % |
30.4 % |
46.4 % |
3.4 % |
2.3 % |
| June |
15.9 % |
31.0 % |
46.6 % |
3.6 % |
2.1 % |
| May |
14.5 % |
32.2 % |
46.9 % |
3.5 % |
2.2 % |
| April |
13.6 % |
33.4 % |
46.4 % |
3.7 % |
2.2 % |
| March |
12.3 % |
34.9 % |
46.2 % |
3.7 % |
2.2 % |
| February |
11.6 % |
35.3 % |
46.5 % |
3.8 % |
2.1 % |
| January |
10.8 % |
36.2 % |
46.3 % |
3.7 % |
2.2 % |
| 2009 |
Chrome |
IE |
Firefox |
Safari |
Opera |
| December |
9.8 % |
37.2 % |
46.4 % |
3.6 % |
2.3 % |
| November |
8.5 % |
37.7 % |
47.0 % |
3.8 % |
2.3 % |
| October |
8.0 % |
37.5 % |
47.5 % |
3.8 % |
2.3 % |
| September |
7.1 % |
39.6 % |
46.6 % |
3.6 % |
2.2 % |
| August |
7.0 % |
39.3 % |
47.4 % |
3.3 % |
2.1 % |
| July |
6.5 % |
39.4 % |
47.9 % |
3.3 % |
2.1 % |
| June |
6.0 % |
40.7 % |
47.3 % |
3.1 % |
2.1 % |
| May |
5.5 % |
41.0 % |
47.7 % |
3.0 % |
2.2 % |
| April |
4.9 % |
42.1 % |
47.1 % |
3.0 % |
2.2 % |
| March |
4.2 % |
43.3 % |
46.5 % |
3.1 % |
2.3 % |
| February |
4.0 % |
43.6 % |
46.4 % |
3.0 % |
2.2 % |
| January |
3.9 % |
44.8 % |
45.5 % |
3.0 % |
2.3 % |
| 2008 |
Chrome |
IE |
Firefox |
Safari |
Opera |
| December |
3.6 % |
46.0 % |
44.4 % |
2.7 % |
2.4 % |
| November |
3.1 % |
47.0 % |
44.2 % |
2.7 % |
2.3 % |
| October |
3.0 % |
47.4 % |
44.0 % |
2.8 % |
2.2 % |
| September |
3.1 % |
49.0 % |
42.6 % |
2.7 % |
2.0 % |
| August |
|
51.0 % |
43.7 % |
2.6 % |
2.1 % |
| July |
|
52.4 % |
42.6 % |
2.5 % |
1.9 % |
| June |
|
54.2 % |
41.0 % |
2.6 % |
1.7 % |
| May |
|
54.4 % |
39.8 % |
2.4 % |
1.5 % |
| April |
|
54.8 % |
39.1 % |
2.2 % |
1.4 % |
| March |
|
53.9 % |
37.0 % |
2.1 % |
1.4 % |
| February |
|
54.7 % |
36.5 % |
2.0 % |
1.4 % |
| January |
|
54.7 % |
36.4 % |
1.9 % |
1.4 % |
| 2007 |
Mozilla |
IE |
Firefox |
Safari |
Opera |
| November |
1.2 % |
56.0 % |
36.3 % |
1.8 % |
1.6 % |
| September |
1.2 % |
57.2 % |
35.4 % |
1.6 % |
1.5 % |
| July |
1.4 % |
58.5 % |
34.5 % |
1.5 % |
1.9 % |
| May |
1.3 % |
58.9 % |
33.7 % |
1.5 % |
1.7 % |
| March |
1.3 % |
58.7 % |
31.8 % |
1.6 % |
1.6 % |
| January |
1.5 % |
58.6 % |
31.0 % |
1.7 % |
1.5 % |
| 2006 |
Mozilla |
IE |
Firefox |
Netscape |
Opera |
| November |
2.5 % |
60.6 % |
29.9 % |
0.2 % |
1.5 % |
| September |
2.3 % |
62.1 % |
27.3 % |
0.4 % |
1.6 % |
| July |
2.3 % |
62.4 % |
25.5 % |
0.4 % |
1.4 % |
| May |
2.3 % |
63.0 % |
25.7 % |
0.3 % |
1.5 % |
| March |
2.4 % |
64.7 % |
24.5 % |
0.5 % |
1.5 % |
| January |
3.1 % |
66.0 % |
25.0 % |
0.5 % |
1.6 % |
| 2005 |
Mozilla |
IE |
Firefox |
Netscape |
Opera |
| November |
2.8 % |
68.9 % |
23.6 % |
0.4 % |
1.5 % |
| September |
2.5 % |
75.5 % |
18.0 % |
0.4 % |
1.2 % |
| July |
2.6 % |
73.8 % |
19.8 % |
0.5 % |
1.2 % |
| May |
3.1 % |
71.6 % |
21.0 % |
0.7 % |
1.3 % |
| March |
3.3 % |
72.5 % |
18.9 % |
1.0 % |
1.9 % |
| January |
3.4 % |
74.5 % |
16.6 % |
1.1 % |
1.9 % |
| 2004 |
Mozilla |
IE |
Netscape |
Opera |
| November |
16.5 % |
76.2 % |
1.7 % |
1.6 % |
| September |
13.7 % |
79.0 % |
2.0 % |
1.7 % |
| July |
12.6 % |
80.4 % |
2.2 % |
1.6 % |
| May |
9.5 % |
81.9 % |
2.4 % |
1.6 % |
| March |
7.9 % |
82.8 % |
2.8 % |
1.4 % |
| January |
5.5 % |
84.7 % |
2.4 % |
1.5 % |
| 2003 |
Mozilla |
IE |
Netscape |
Opera |
| November |
7.2 % |
84.9 % |
2.6 % |
1.9 % |
| September |
6.2 % |
86.6 % |
2.7 % |
1.8 % |
| July |
5.7 % |
87.2 % |
2.7 % |
1.7 % |
| May |
4.6 % |
87.7 % |
3.3 % |
1.4 % |
| March |
4.2 % |
88.0 % |
3.4 % |
1.2 % |
| January |
4.0 % |
84.6 % |
4.0 % |
|
| 2002 |
AOL |
IE |
Netscape |
| November |
5.2 % |
83.4 % |
8.0 % |
| September |
4.5 % |
83.5 % |
8.0 % |
| July |
3.5 % |
84.5 % |
7.3 % |
| May |
2.8 % |
86.7 % |
7.3 % |
| March |
3.0 % |
86.1 % |
7.7 % |
| January |
2.8 % |
85.8 % |
7.9 % |
|
IE = Microsoft Internet Explorer
Firefox = Mozilla Firefox (identified as Mozilla before
2005)
Chrome = Google Chrome
Mozilla = The Mozilla Suite (Gecko, Netscape)
Safari = Apple Safari (and Konqueror. Both identified as
Mozilla before 2007)
Opera = Opera (from 2011; Opera Mini is included
here)
Netscape = Netscape Navigator (identified as Mozilla
after 2006)
AOL = America Online (based on both Internet Explorer and
Mozilla)
|
Statistics Can Be Misleading
You cannot - as a web developer - rely ONLY on statistics. Statistics can be
misleading. There are many different types of sources and the primary audience
of the source will make a notable difference in the results.
EXAMPLE: W3Schools is a website for people with an interest for web
technologies, therefore the visitor statistics will reflect a more tech-savvy
demographic. These people are more interested in using alternative browsers
than the average user. The average user tends to use the browser that comes
preinstalled with their computers, and do not seek out other browser
alternatives.
Tip: Different sites attract different audiences. Some web sites only
attract the casual internet surfer using older computers and OEM software. There
are others which attract professional developers using the most up-to-date
professional hardware and software. Then there are some which may cater to the
hardcore computer geeks who run high performance hardware and custom
software.
The data collected from W3Schools' log-files over many years, shows the long
term trends of a particular type of audience that leans more towards the
tech-savvy professionals.
Other Statistics
Operating System Statistics
Screen Resolution Statistics
OS Platform Statistics
What is the trend in Operating Systems usage?
Have you ever tried to purchase a computer that did not have a version of the
Microsoft Windows Operating system preinstalled? Good luck, it is virtually
impossible to buy a computer from a retailer that does not have a version of
Windows preinstalled. Therefore, when you come across a number of visitors
who register with Linux as their Operating Systems, then you know that you are
not dealing with an average user.
OS Platform Statistics and Trends
Statistics are important information.
From the statistics below (collected from W3Schools' log-files since 2003),
you can see the long term trends of Operating System usage by their
visitors.
OS Platform Statistics
*NT includes all Windows Server operating systems (like Windows 2000, Windows
Server 2003 and 2008).
| 2015 |
Win10 |
Win8 |
Win7 |
Vista |
NT* |
WinXP |
Linux |
Mac |
Mobile |
| December |
15.5% |
16.3% |
44.5% |
0.4% |
0.1% |
2.3% |
5.6% |
9.9% |
5.3% |
| November |
14.1% |
16.9% |
45.2% |
0.5% |
0.1% |
2.2% |
5.4% |
10.6% |
5.0% |
| October |
12.6% |
17.3% |
46.2% |
0.5% |
0.1% |
2.4% |
5.4% |
10.4% |
5.0% |
| September |
10.6% |
18.0% |
47.6% |
0.5% |
0.1% |
2.7% |
5.6% |
10.0% |
5.0% |
| August |
3.5% |
19.4% |
47.2% |
1.2% |
0.3% |
3.6% |
5.4% |
10.9% |
5.0% |
| July |
|
23.1% |
48.6% |
1.4% |
0.1% |
4.0% |
5.6% |
11.4% |
5.0% |
| June |
|
23.3% |
50.7% |
0.7% |
0.1% |
3.4% |
5.9% |
9.9% |
5.4% |
| May |
|
23.5% |
51.1% |
0.7% |
0.1% |
3.3% |
5.5% |
10.2% |
5.4% |
| April |
|
22.8% |
52.1% |
0.7% |
0.1% |
3.6% |
5.2% |
10.2% |
5.0% |
| March |
|
22.2% |
52.3% |
0.7% |
0.1% |
4.1% |
5.3% |
10.1% |
5.0% |
| February |
|
21.3% |
52.5% |
0.8% |
0.1% |
4.5% |
5.4% |
10.1% |
5.0% |
| January |
|
21.0% |
52.8% |
0.8% |
0.1% |
4.7% |
5.5% |
9.8% |
5.0% |
| 2014 |
Win8 |
Win7 |
Vista |
NT* |
WinXP |
Linux |
Mac |
Mobile |
| December |
20.5% |
53.8% |
0.8% |
0.2% |
4.9% |
5.4% |
9.5% |
4.8% |
| November |
19.7% |
54.6% |
1.0% |
0.2% |
4.9% |
5.4% |
9.6% |
4.5% |
| October |
19.2% |
54.6% |
1.0% |
0.2% |
5.1% |
5.4% |
10.3% |
4.3% |
| September |
18.1% |
55.5% |
1.0% |
0.2% |
5.9% |
5.5% |
9.6% |
4.3% |
| August |
18.1% |
54.2% |
1.0% |
0.2% |
6.5% |
5.6% |
9.7% |
4.9% |
| July |
17.3% |
54.8% |
1.0% |
0.2% |
7.0% |
5.6% |
9.5% |
4.6% |
| June |
17.0% |
55.3% |
1.1% |
0.2% |
7.1% |
5.3% |
9.6% |
4.3% |
| May |
16.6% |
55.2% |
1.2% |
0.2% |
7.3% |
5.1% |
10.0% |
4.2% |
| April |
15.8% |
55.4% |
1.2% |
0.2% |
8.0% |
5.0% |
10.3% |
4.0% |
| March |
15.0% |
55.1% |
1.3% |
0.2% |
9.4% |
4.9% |
9.9% |
4.0% |
| February |
14.2% |
55.0% |
1.4% |
0.3% |
10.1% |
5.0% |
10.0% |
4.0% |
| January |
13.4% |
55.3% |
1.5% |
0.3% |
11.0% |
4.9% |
9.6% |
4.0% |
| 2013 |
Win8 |
Win7 |
Vista |
NT* |
WinXP |
Linux |
Mac |
Mobile |
| December |
10.0% |
55.9% |
1.5% |
3.1% |
11.6% |
4.8% |
9.2% |
3.8% |
| November |
8.6% |
56.4% |
1.6% |
3.7% |
11.7% |
4.8% |
9.6% |
3.7% |
| October |
9.9% |
56.7% |
1.6% |
1.4% |
12.4% |
4.9% |
9.6% |
3.3% |
| September |
10.2% |
56.8% |
1.6% |
0.4% |
13.5% |
4.8% |
9.3% |
3.3% |
| August |
9.6% |
55.9% |
1.7% |
0.4% |
14.7% |
5.0% |
9.2% |
3.4% |
| July |
9.0% |
56.2% |
1.8% |
0.4% |
15.8% |
4.9% |
8.7% |
3.2% |
| June |
8.6% |
56.3% |
2.0% |
0.4% |
15.4% |
4.9% |
9.1% |
3.2% |
| May |
7.9% |
56.4% |
2.1% |
0.4% |
15.7% |
4.9% |
9.7% |
2.6% |
| April |
7.3% |
56.4% |
2.2% |
0.4% |
16.4% |
4.8% |
9.7% |
2.2% |
| March |
6.7% |
55.9% |
2.4% |
0.4% |
17.6% |
4.7% |
9.5% |
2.3% |
| February |
5.7% |
55.3% |
2.4% |
0.4% |
19.1% |
4.8% |
9.6% |
2.2% |
| January |
4.8% |
55.3% |
2.6% |
0.5% |
19.9% |
4.8% |
9.3% |
2.2% |
| 2012 |
Win8 |
Win7 |
Vista |
NT* |
WinXP |
Linux |
Mac |
Mobile |
| December |
2.5% |
55.6% |
2.8% |
1.8% |
21.1% |
4.7% |
8.7% |
2.2% |
| November |
|
56.5% |
2.9% |
3.0% |
20.8% |
4.8% |
9.4% |
2.0% |
| October |
|
56.8% |
3.0% |
1.8% |
22.1% |
4.8% |
9.2% |
1.8% |
| September |
|
55.7% |
3.1% |
1.5% |
23.6% |
4.7% |
8.9% |
1.8% |
| August |
|
54.5% |
3.2% |
1.3% |
24.8% |
5.0% |
8.7% |
1.8% |
| July |
|
53.8% |
3.4% |
1.2% |
26.1% |
4.9% |
8.2% |
1.7% |
| June |
|
53.2% |
3.7% |
1.1% |
26.2% |
5.0% |
8.6% |
1.6% |
| May |
|
52.3% |
3.9% |
1.1% |
26.8% |
4.9% |
9.0% |
1.6% |
| April |
|
51.3% |
4.2% |
1.0% |
27.3% |
4.9% |
9.3% |
1.5% |
| March |
|
49.9% |
4.3% |
1.0% |
28.9% |
4.9% |
8.9% |
1.4% |
| February |
|
48.7% |
4.5% |
0.8% |
30.0% |
5.0% |
9.1% |
1.3% |
| January |
|
47.1% |
4.8% |
0.9% |
31.4% |
4.9% |
9.0% |
1.3% |
| 2011 |
Win7 |
Vista |
Win2003 |
WinXP |
Linux |
Mac |
Mobile |
| December |
46.1% |
5.0% |
0.7% |
32.6% |
4.9% |
8.5% |
1.2% |
| November |
45.5% |
5.2% |
0.7% |
32.8% |
5.1% |
8.8% |
1.0% |
| October |
44.7% |
5.5% |
0.7% |
33.4% |
5.0% |
8.9% |
1.0% |
| September |
42.2% |
5.6% |
0.8% |
36.2% |
5.1% |
8.6% |
0.9% |
| August |
40.4% |
5.9% |
0.8% |
38.0% |
5.2% |
8.2% |
0.9% |
| July |
39.1% |
6.3% |
0.9% |
39.1% |
5.3% |
7.8% |
1.0% |
| June |
37.8% |
6.7% |
0.9% |
39.7% |
5.2% |
8.1% |
0.9% |
| May |
36.5% |
7.1% |
0.9% |
40.7% |
5.1% |
8.3% |
0.8% |
| April |
35.9% |
7.6% |
0.9% |
40.9% |
5.1% |
8.3% |
0.8% |
| March |
34.1% |
7.9% |
0.9% |
42.9% |
5.1% |
8.0% |
0.7% |
| February |
32.2% |
8.3% |
1.0% |
44.2% |
5.1% |
8.1% |
0.7% |
| January |
31.1% |
8.6% |
1.0% |
45.3% |
5.0% |
7.8% |
0.7% |
| 2010 |
Win7 |
Vista |
Win2003 |
WinXP |
Win2k |
Linux |
Mac |
| December |
29.1% |
8.9% |
1.1% |
47.2% |
0.2% |
5.0% |
7.3% |
| November |
28.5% |
9.5% |
1.1% |
47.0% |
0.2% |
5.0% |
7.7% |
| October |
26.8% |
9.9% |
1.1% |
48.9% |
0.3% |
4.7% |
7.6% |
| September |
24.3% |
10.0% |
1.1% |
51.7% |
0.3% |
4.6% |
7.2% |
| August |
22.3% |
10.5% |
1.3% |
53.1% |
0.4% |
4.9% |
6.7% |
| July |
20.6% |
10.9% |
1.3% |
54.6% |
0.4% |
4.8% |
6.5% |
| June |
19.8% |
11.7% |
1.3% |
54.6% |
0.4% |
4.8% |
6.8% |
| May |
18.9% |
12.4% |
1.3% |
55.3% |
0.4% |
4.5% |
6.7% |
| April |
16.7% |
13.2% |
1.3% |
56.1% |
0.5% |
4.5% |
7.1% |
| March |
14.7% |
13.7% |
1.4% |
57.8% |
0.5% |
4.5% |
6.9% |
| February |
13.0% |
14.4% |
1.4% |
58.4% |
0.6% |
4.6% |
7.1% |
| January |
11.3% |
15.4% |
1.4% |
59.4% |
0.6% |
4.6% |
6.8% |
| 2009 |
Win7 |
Vista |
Win2003 |
WinXP |
Win2k |
Linux |
Mac |
| December |
9.0% |
16.0% |
1.4% |
61.6% |
0.6% |
4.5% |
6.5% |
| November |
6.7% |
17.5% |
1.4% |
62.2% |
0.7% |
4.3% |
6.7% |
| October |
4.4% |
18.6% |
1.5% |
63.3% |
0.7% |
4.2% |
6.8% |
| September |
3.2% |
18.3% |
1.5% |
65.2% |
0.8% |
4.1% |
6.5% |
| August |
2.5% |
18.1% |
1.6% |
66.2% |
0.9% |
4.2% |
6.1% |
| July |
1.9% |
17.7% |
1.7% |
67.1% |
1.0% |
4.3% |
6.0% |
| June |
1.6% |
18.3% |
1.7% |
66.9% |
1.0% |
4.2% |
5.9% |
| May |
1.1% |
18.4% |
1.7% |
67.2% |
1.1% |
4.1% |
6.1% |
| April |
0.7% |
17.9% |
1.7% |
68.0% |
1.2% |
4.0% |
6.1% |
| March |
0.5% |
17.3% |
1.7% |
68.9% |
1.3% |
4.0% |
5.9% |
| February |
0.4% |
17.2% |
1.6% |
69.0% |
1.4% |
4.0% |
6.0% |
| January |
0.2% |
16.5% |
1.6% |
69.8% |
1.6% |
3.9% |
5.8% |
| 2008 |
Vista |
W2003 |
WinXP |
Win2k |
Win98 |
Linux |
Mac |
| December |
15.6% |
1.7% |
71.4% |
1.7% |
0.1% |
3.8% |
5.3% |
| November |
15.1% |
1.6% |
72.0% |
1.8% |
0.1% |
3.8% |
5.3% |
| October |
14.4% |
1.7% |
72.2% |
1.9% |
0.2% |
3.8% |
5.5% |
| September |
13.2% |
1.8% |
73.3% |
2.2% |
0.2% |
3.8% |
5.2% |
| August |
12.5% |
1.9% |
73.9% |
2.4% |
0.2% |
3.9% |
4.9% |
| July |
11.5% |
2.0% |
74.7% |
2.6% |
0.2% |
3.9% |
4.8% |
| June |
10.0% |
1.9% |
74.6% |
2.6% |
0.2% |
3.7% |
4.8% |
| May |
9.3% |
1.8% |
74.0% |
2.9% |
0.3% |
3.6% |
4.7% |
| April |
8.8% |
1.9% |
73.3% |
3.3% |
0.5% |
3.7% |
4.6% |
| March |
8.5% |
1.9% |
72.7% |
3.7% |
0.6% |
3.9% |
4.4% |
| February |
7.8% |
1.8% |
72.4% |
4.0% |
0.8% |
3.8% |
4.3% |
| January |
7.3% |
1.9% |
73.6% |
4.0% |
0.8% |
3.6% |
4.4% |
| 2007 |
Vista |
W2003 |
WinXP |
Win2k |
Win98 |
Linux |
Mac |
| November |
6.3% |
2.0% |
73.8% |
5.1% |
1.0% |
3.3% |
3.9% |
| September |
4.5% |
2.0% |
74.3% |
5.4% |
0.9% |
3.4% |
3.9% |
| July |
3.6% |
2.0% |
74.6% |
6.0% |
0.9% |
3.4% |
4.0% |
| May |
2.8% |
1.9% |
75.0% |
6.5% |
0.9% |
3.4% |
3.9% |
| March |
1.9% |
1.9% |
76.0% |
7.2% |
0.9% |
3.4% |
3.8% |
| January |
0.6% |
1.9% |
76.1% |
7.7% |
1.0% |
3.6% |
3.8% |
| 2006 |
Win2003 |
WinXP |
Win2k |
Win98 |
WinNT |
Linux |
Mac |
| November |
1.9% |
74.9% |
8.0% |
1.0% |
0.3% |
3.5% |
3.6% |
| September |
2.0% |
74.6% |
9.2% |
1.4% |
0.3% |
3.5% |
3.6% |
| July |
2.0% |
74.3% |
10.1% |
1.5% |
0.3% |
3.4% |
3.6% |
| May |
2.0% |
74.2% |
10.7% |
1.6% |
0.2% |
3.4% |
3.6% |
| March |
1.8% |
72.9% |
11.9% |
2.0% |
0.3% |
3.4% |
3.5% |
| January |
1.7% |
72.3% |
13.1% |
2.4% |
0.3% |
3.3% |
3.5% |
| 2005 |
Win2003 |
WinXP |
Win2k |
Win98 |
WinNT |
Linux |
Mac |
| November |
1.7% |
71.0% |
14.6% |
2.7% |
0.4% |
3.3% |
3.3% |
| September |
1.7% |
69.2% |
15.8% |
3.2% |
0.5% |
3.3% |
3.1% |
| July |
1.6% |
65.3% |
17.7% |
3.9% |
0.6% |
3.5% |
3.0% |
| May |
1.4% |
64.5% |
19.4% |
3.9% |
0.8% |
3.3% |
2.9% |
| March |
1.4% |
63.1% |
20.2% |
4.7% |
0.9% |
3.2% |
3.0% |
| January |
1.2% |
61.3% |
21.6% |
5.3% |
1.0% |
3.2% |
2.8% |
| 2004 |
WinXP |
Win2k |
Win98 |
WinNT |
Win95 |
Linux |
Mac |
| November |
59.1% |
23.7% |
5.6% |
1.2% |
0.1% |
3.1% |
2.7% |
| September |
55.9% |
26.2% |
6.4% |
1.5% |
0.2% |
3.1% |
2.6% |
| July |
52.5% |
28.4% |
7.5% |
1.9% |
0.2% |
3.1% |
2.4% |
| May |
51.0% |
29.6% |
8.2% |
2.0% |
0.3% |
2.9% |
2.5% |
| March |
48.0% |
31.1% |
9.4% |
2.4% |
0.4% |
2.6% |
2.4% |
| January |
44.1% |
33.6% |
10.4% |
3.0% |
0.4% |
2.7% |
2.4% |
| 2003 |
WinXP |
Win2k |
Win98 |
WinNT |
Win95 |
Linux |
Mac |
| November |
42.6% |
36.3% |
10.9% |
3.5% |
0.4% |
2.6% |
2.2% |
| September |
38.0% |
37.9% |
12.1% |
4.1% |
0.5% |
2.4% |
2.0% |
| July |
33.9% |
40.6% |
12.6% |
5.3% |
0.6% |
2.3% |
1.9% |
| May |
31.4% |
41.0% |
13.9% |
5.8% |
0.7% |
2.2% |
1.8% |
| March |
29.1% |
41.9% |
14.8% |
6.6% |
0.8% |
2.2% |
1.8% |
Statistics Can Be Misleading
You cannot - as a web developer - rely ONLY on statistics. Statistics can be
misleading if not interpreted correctly.
Note: W3Schools is a website geared towards people with an interest
for web technologies. The visitor will be more apt to using an alternative
Operating System platform or upgrade to the latest version of the Widows OS than
the average user. The average user tends to use only the OS that comes
preinstalled with their computer, and do not seek out other alternatives.
Tip: Global averages may not be relevant to your web site, therefore
the source's demographic becomes a very important consideration. Different
sites attract different audiences. Some web sites attract, mainly casual
internet surfers that use off-the-shelf computers, which would mainly show the
average current user trends while other sites may attract a more advanced user
using the latest hardware and software
The data collected from W3Schools' log-files over many years, clearly shows
the long term trends of their visitors.
Other Statistics
browser Statistics
Screen Resolution Statistics